Climate change is leading to changes in wildfires. As the temperature increases, so conditions become drier and more supportive of longer and more active fire seasons. One measure of wildfire activity is burned area; it has been shown that the total burned area of US wildfires has increased since the 1980s.
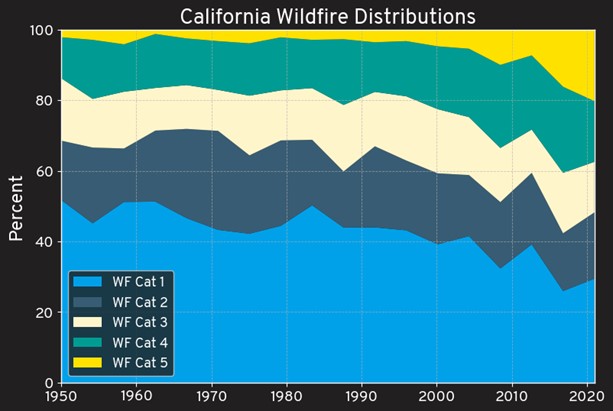
To better understand how the size of wildfires is changing over time, we utilise the concept of event category used to classify hurricanes. Hurricane strength is categorised from 1-5 using the Saffir-Simpson scale based on hurricane maximum sustained windspeeds which provides an estimate of potential damage. The percentage of tropical storms and category 1-5 hurricanes from the IBTrACS observed record of North Atlantic tropical cyclones is calculated, then from the CalFire wildfire perimeter data California wildfires are classified according to the same frequencies as calculated for Atlantic hurricanes. For example, only 2.5% of tropical cyclones reach Cat 5 status, so only 2.5% of wildfires are classified as WF Cat 5.
The percentage occurrence of each wildfire category in each year (averaged over a four-year period) is shown in the chart below. The largest wildfires are the WF Cat 5s shown in yellow. In the 1950s to the early 1990s they only made up 1% – 2% of the total number of wildfires in any given year. Since the mid-1990s however, this percentage has been increasing, up to 20% between 2017-2021. The very largest wildfires, WF Cat 5s, are the most difficult to contain due to their size and they are often the most destructive and associated with the largest insurance losses.


