In this year’s unique hurricane season, we have a “Battle Royale” between the warm Atlantic sea surface temperatures (SSTs) and the developing El Nino event. El Nino events are characterised by anomalously warm SSTs in the Central Pacific but, through atmospheric teleconnections, can reduce the number of Atlantic hurricanes.
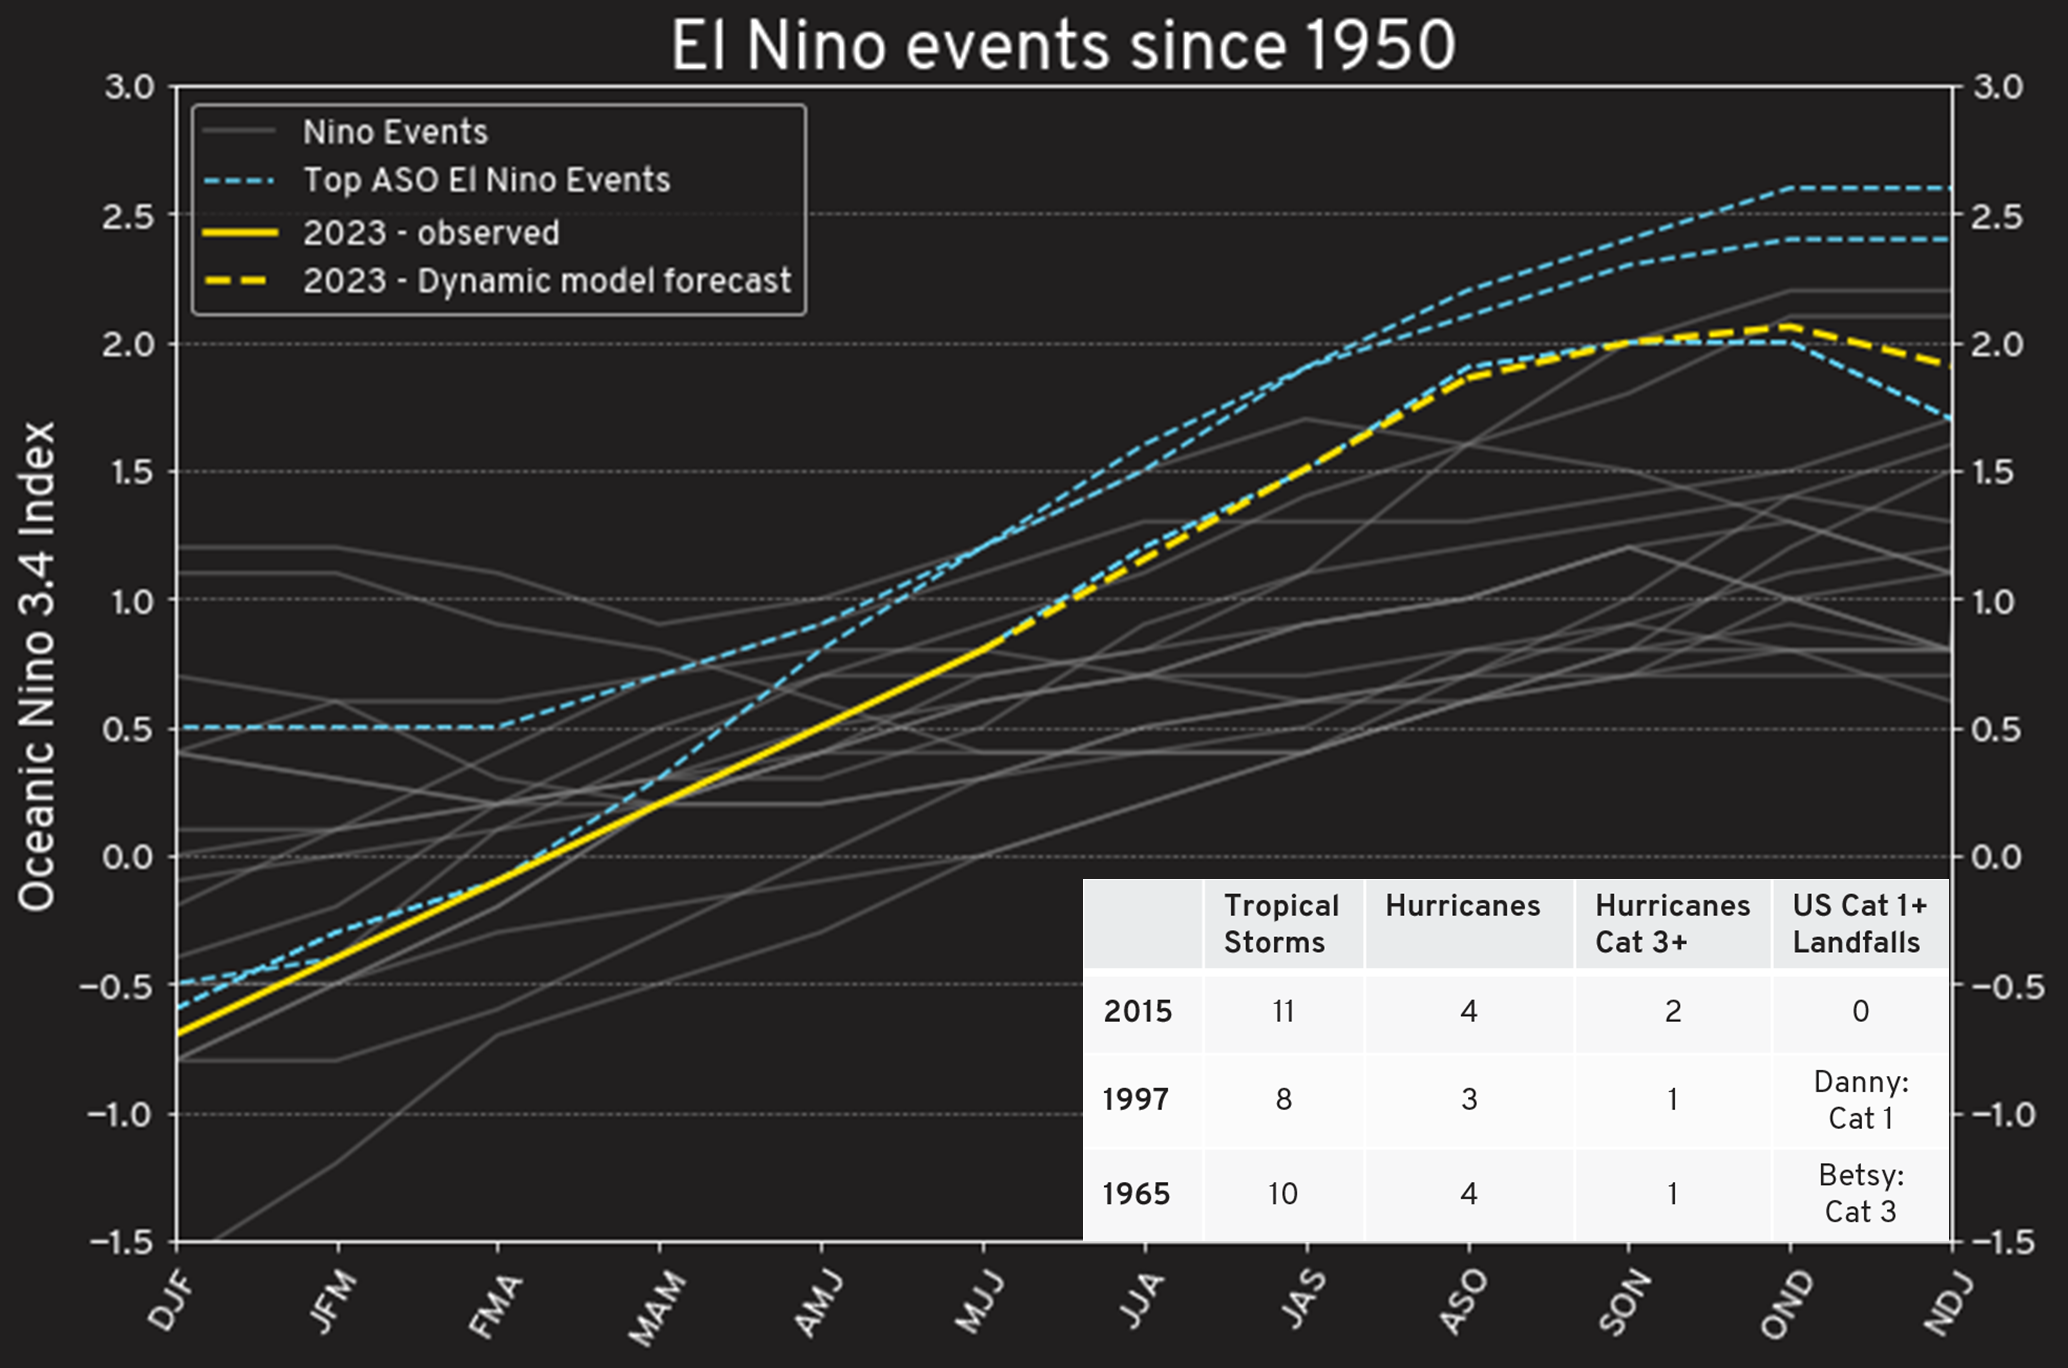
The chart below shows the three-monthly average Oceanic Nino 3.4 index for El Nino events since 1950. There are 30 events where the August-September-October (ASO) index – coincident with the hurricane season – is greater than 0.5. Using data from Columbia University, the forecast of the El Nino event is plotted alongside the observed historical data. In ASO, this year’s El Nino is forecast to be the fourth strongest El Nino since 1950. The strongest was in 2015, second, 1997 and third, 1965.
The table shows the Atlantic hurricane activity for these years. In 2015 there were no US landfalling hurricanes, in 1997 Danny made landfall as category 1 hurricane but caused only minimal damage. In 1965, Betsy made landfall as a strong category 3 hurricane first in Florida and then in Louisiana and became known as “Billion Dollar Betsy”, being the first hurricane to cause more than $1 billion of damage (the total cost was approximately $43 billion in today’s money). It remains to be seen whether the exceptionally warm seas might have an additional say in this season’s final numbers.


